Excel Two Thousand and Wat

There’s no perfect tool. Things get done well when you know your tools inside and out. Because I enjoy complaining about Excel, and because I enjoy Gary Bernhardt’s “wat” talk about typically unexpected behaviors in JavaScript and Ruby, I offer here “Excel Two Thousand and Wat”, combining some personal pet peeves and a few other Excel oddities. (I’m using Excel 2011 for Mac; your mileage may vary.)

Let’s talk about Excel.

Say we have a nice UTF-8 CSV file:

$ wc test.csv
       8       8      56 test.csv
$ cat test.csv
id,value
001,1
010,2
01a,3
100,4
101,하하
110,5
111,6
$ file test.csv
test.csv: UTF-8 Unicode text

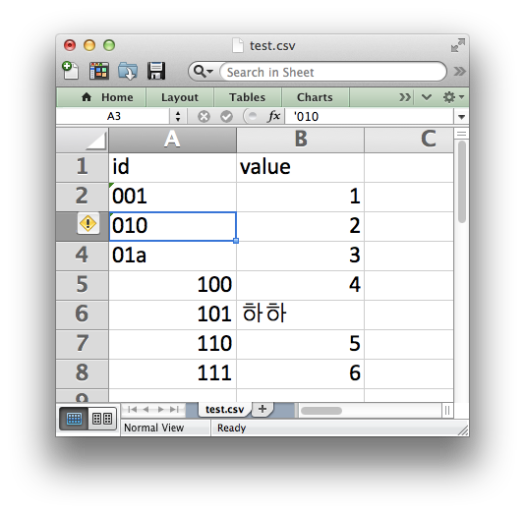
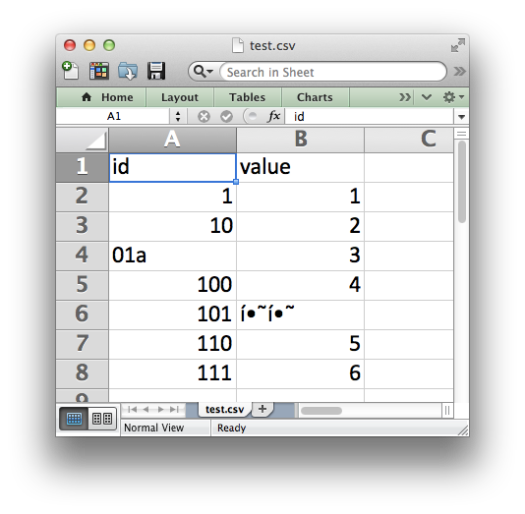
It has eight lines: a header and seven rows of data. It has two columns: an ID column and a value column. The IDs are all three characters long. The values have some unicode: Korean characters for “ha ha”. So of course Excel will have no problem opening this.

excel window

wat

Excel has kindly munched the leading zeros from our ID column. Why would we want the data that was in the file we opened, after all? And of course, it is totally appropriate for modern software to not understand UTF-8 encoded text.

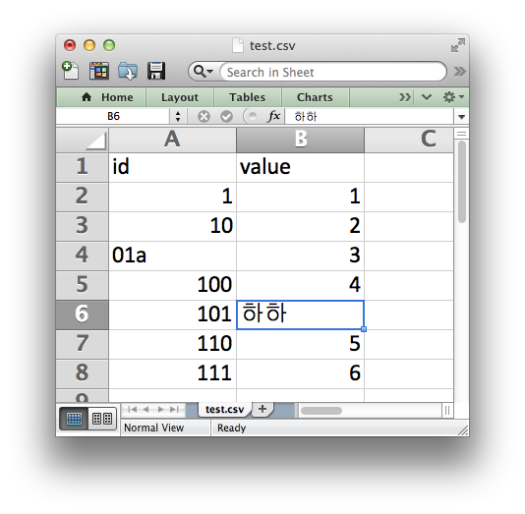
Well, we can fix this! We can type the Korean into Excel by hand.

excel window

And we can fix the chomped IDs by typing them in with a leading apostrophe. Obviously.

excel window

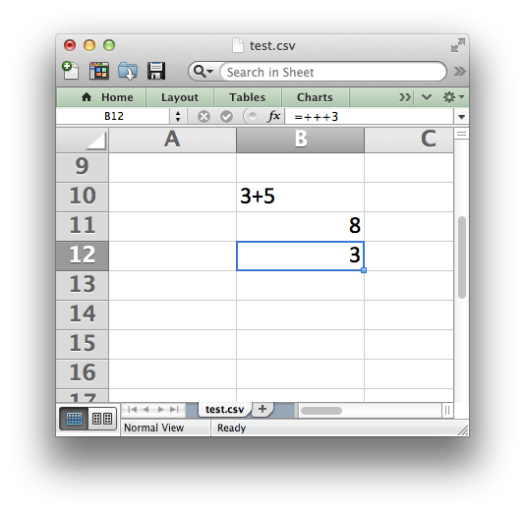
Excel is so helpful, second-guessing the data type of every cell. This is a great feature! For example, Excel will render “3+5” as “3+5” but show “=3+5” as “8” – it uses that equal sign to know if it’s supposed to evaluate an equation. Great! So something like “++++3”, which is obviously not an equation, will be fine!

excel window

wat

Excel took the entry of “++++3” and then: a) turned it into an equation, and b) ate one of the pluses. If you re-evaluate the cell (with Ctrl-u, Ctrl-Enter, for instance) Excel will keep eating pluses.

But enough confusion! Let’s talk about Excel.

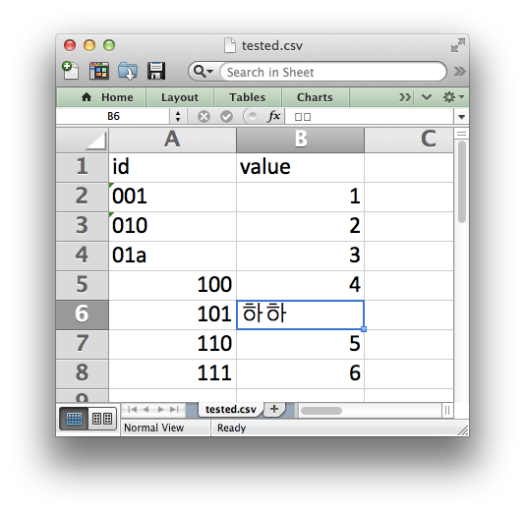
Since we’ve fixed the errors introduced by Excel, let’s go ahead and save as a new CSV file, tested.csv. Nothing will have changed, of course, with the worksheet that we still have open.

excel window

Oh good – the Korean we typed in still appears in the sheet, but in the formula bar now it’s two empty boxes.

wat

Things will look fine in the file though, certainly.

$ wc tested.csv 
       0       8      51 tested.csv
$ cat tested.csv 
111,6$ e

Now our CSV has zero lines, and confuses the heck out of bash. Good. What if we re-open the file in Excel?

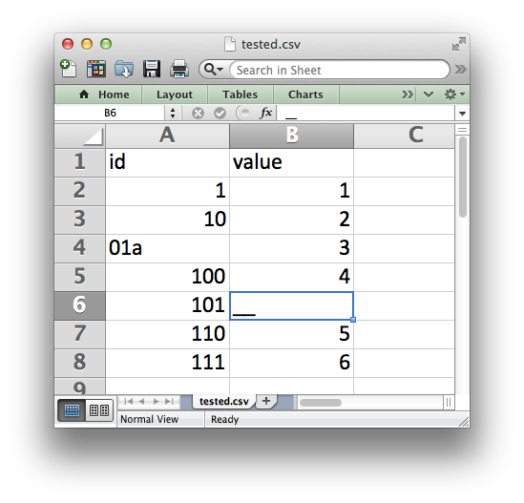
excel window

The leading zeros we took pains to put back in are cleaned out again, and the Korean has been helpfully simplified to two underscores.

But enough about failures to get the basics right. Let’s talk about Excel.

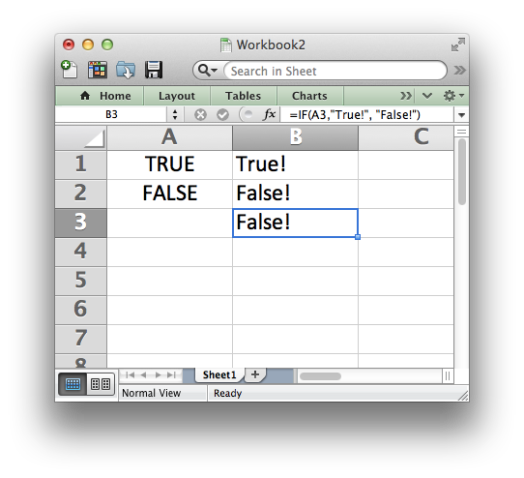
Excel famously does a great job of handling missing values. If you type in “TRUE” it’s the boolean truth value, and “FALSE” is false. We can check with an “if” statement in an equation. What should an empty cell be?

excel window

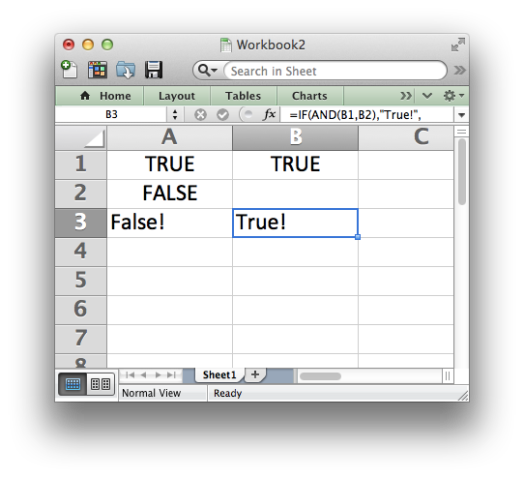
An empty cell is false, naturally. We can check it with “and” in an equation as well. “True and false” is false, as we all know.

excel window

Ah – “True and blank” is true, so… blank is also true. Got it?

wat

That’s enough! (Of course there are also my gripes with how Excel’s PERCENTRANK works.) Have fun, and use your tools well!
Use counts, not percentages

Consider this data:

total    part   percent
  765      47        6%

Clearly, there is some redundancy. Both part and percent express the same thing.

With infinite precision, you could use either part or percent at your pleasure. However, in the common case where the counts (total and part) are integers and the percentage(s) are not, computers will store the integers generally much more nicely and compactly than nasty decimal things (floats or string representations).

Percentages also commonly get rounded off, in which case information is lost. In the above example, 6% of 765 could be anything from 43 to 49, and possibly even more depending on what precision is used for the calculation.

The moral of the story is that for data, you should always use counts, not percentages.

Number-line comparisons are good for code

You have a lot of flexibility in how you write comparisons with most programming languages. Typically, for example, you can use either of x < 5 and 5 > x.

I recommend the convention of writing comparisons as if they come from a number line. That is, always use “<” and “<=“, and never use “>” and “>=“.

This convention reduces cognitive load – it makes code easier to read and write. This is particularly true when testing ranges, and I find it  to make an exceptionally large difference in the common case of testing date ranges. Compare the following two lines of pseudo-code:

date > 2010-04-23 & date < 2010-08-11 # bad
2010-04-23 < date & date < 2010-08-11 # good

The second line is much more readable than the first. Indeed, even less clear versions are possible. It becomes easy to introduce errors, and even not unlikely that you’ll be testing for impossible ranges.

In some languages (notably Python) you can write chained comparisons like 3 < x < 5 and it will work as expected. In some languages you can write chained comparisons like that and it will evaluate but probably not as you intended. In JavaScript, 3 < 4 < 2 is true. (wat) In Ruby and R, chained comparisons like these will give you an error. So I prefer the style already shown, with the variable being tested close to the “and” operator joining the two comparisons.

Many languages use “=” for assignment and “==” for testing equality, so it has been noted that 5 == x is safer than x == 5 in the sense that if you mistakenly write x = 5 then you’ve broken something, but 5 = x is just an error that will get caught. I’m not terribly concerned about this. In both Python and R, the equivalent of “if x = 5” is an error.

Since R uses “<-” for assignment, there is a similar possible problem:

x < -2 # compares x to -2
x <-2  # assigns -2 to x

This is indeed annoying. (Thanks Tommy for pointing it out.) I think the advantages of writing nice number-line comparisons outweigh this risk in R, but it is the most compelling argument I’ve seen for not using “<-” for assignment.

Building Predictive Models for NYC High Schools

I don’t have anything to say about building predictive models today myself, but I did want to share this paper from Alec Hubel, which demonstrates some of the really interesting things that you can do even with just the publicly available education data out there on the net.

Common warnings about correlation vs. causation in education definitely apply, but I think this provides a really neat look at some of the data that NYC makes available. I like it even just for the second figure, which is a simple but rarely seen visualization that makes it easy to explore, by looking, some of the patterns across districts.

Thanks Alec!